
Contract management KPIs: 16 metrics worth tracking

Rezvan Golestaneh
Published · 11 min read
This post explains 16 contract management KPIs and how to start tracking them.
- Measure contract speed, value, deadlines and workload.
- Choose three KPIs tied to one goal.
- Set a baseline and review monthly.
- Keep currencies and contract types separate.
“How long do our contracts take?”
Sales remembers a delay. Legal remembers missing details. Nobody has a clear answer.
Contract management KPIs show how well your team creates, approves, signs and manages agreements. Start with a few reliable measures of speed, deadlines and value. A dashboard full of guesses is still guessing.
What are contract management KPIs?
Contract management KPIs are key performance indicators used to assess whether your contract process is meeting its goals.
A metric measures something; a KPI is a metric you’ve chosen because it tells you whether an important goal is being met.
These indicators cover speed, value, risk and workload. Some measure the process before signing, such as approval time. Others measure what happens afterward, such as whether obligations are completed on time.
Contract performance metrics focus on how signed agreements perform. Contract KPIs also cover the work needed to get those agreements signed and keep their records useful. As legal department metrics, they show work that legal shares with sales, finance, operations and procurement.
Which contract management KPIs should you track?
The 16 contract management KPIs below cover turnaround time, standard terms, renewal decisions, obligations, portfolio value and unfinished work.
Speed deserves attention: Wolters Kluwer found that 40% of in-house legal teams struggle to track contract KPIs at all, and 33% name long turnaround times as a major challenge. Broader contract management statistics provide context, but your targets should reflect your own agreements and process.
For each calculation, use a defined reporting period or snapshot date. Compare similar contract types, and use the same counting rules every time.
1. Contract cycle time
Contract cycle time measures elapsed time from the initial request to the final required signature. A downward trend is useful when review quality holds steady, but separate routine agreements from complex negotiations. Include waiting time, even when the hold-up is missing information.
How to measure: Add up the calendar days from request to final signature for contracts fully signed during the period, then divide by the number of those contracts.
Data: Request timestamps and final signature timestamps from intake records, email and signature records.
2. Renewals handled before the notice deadline
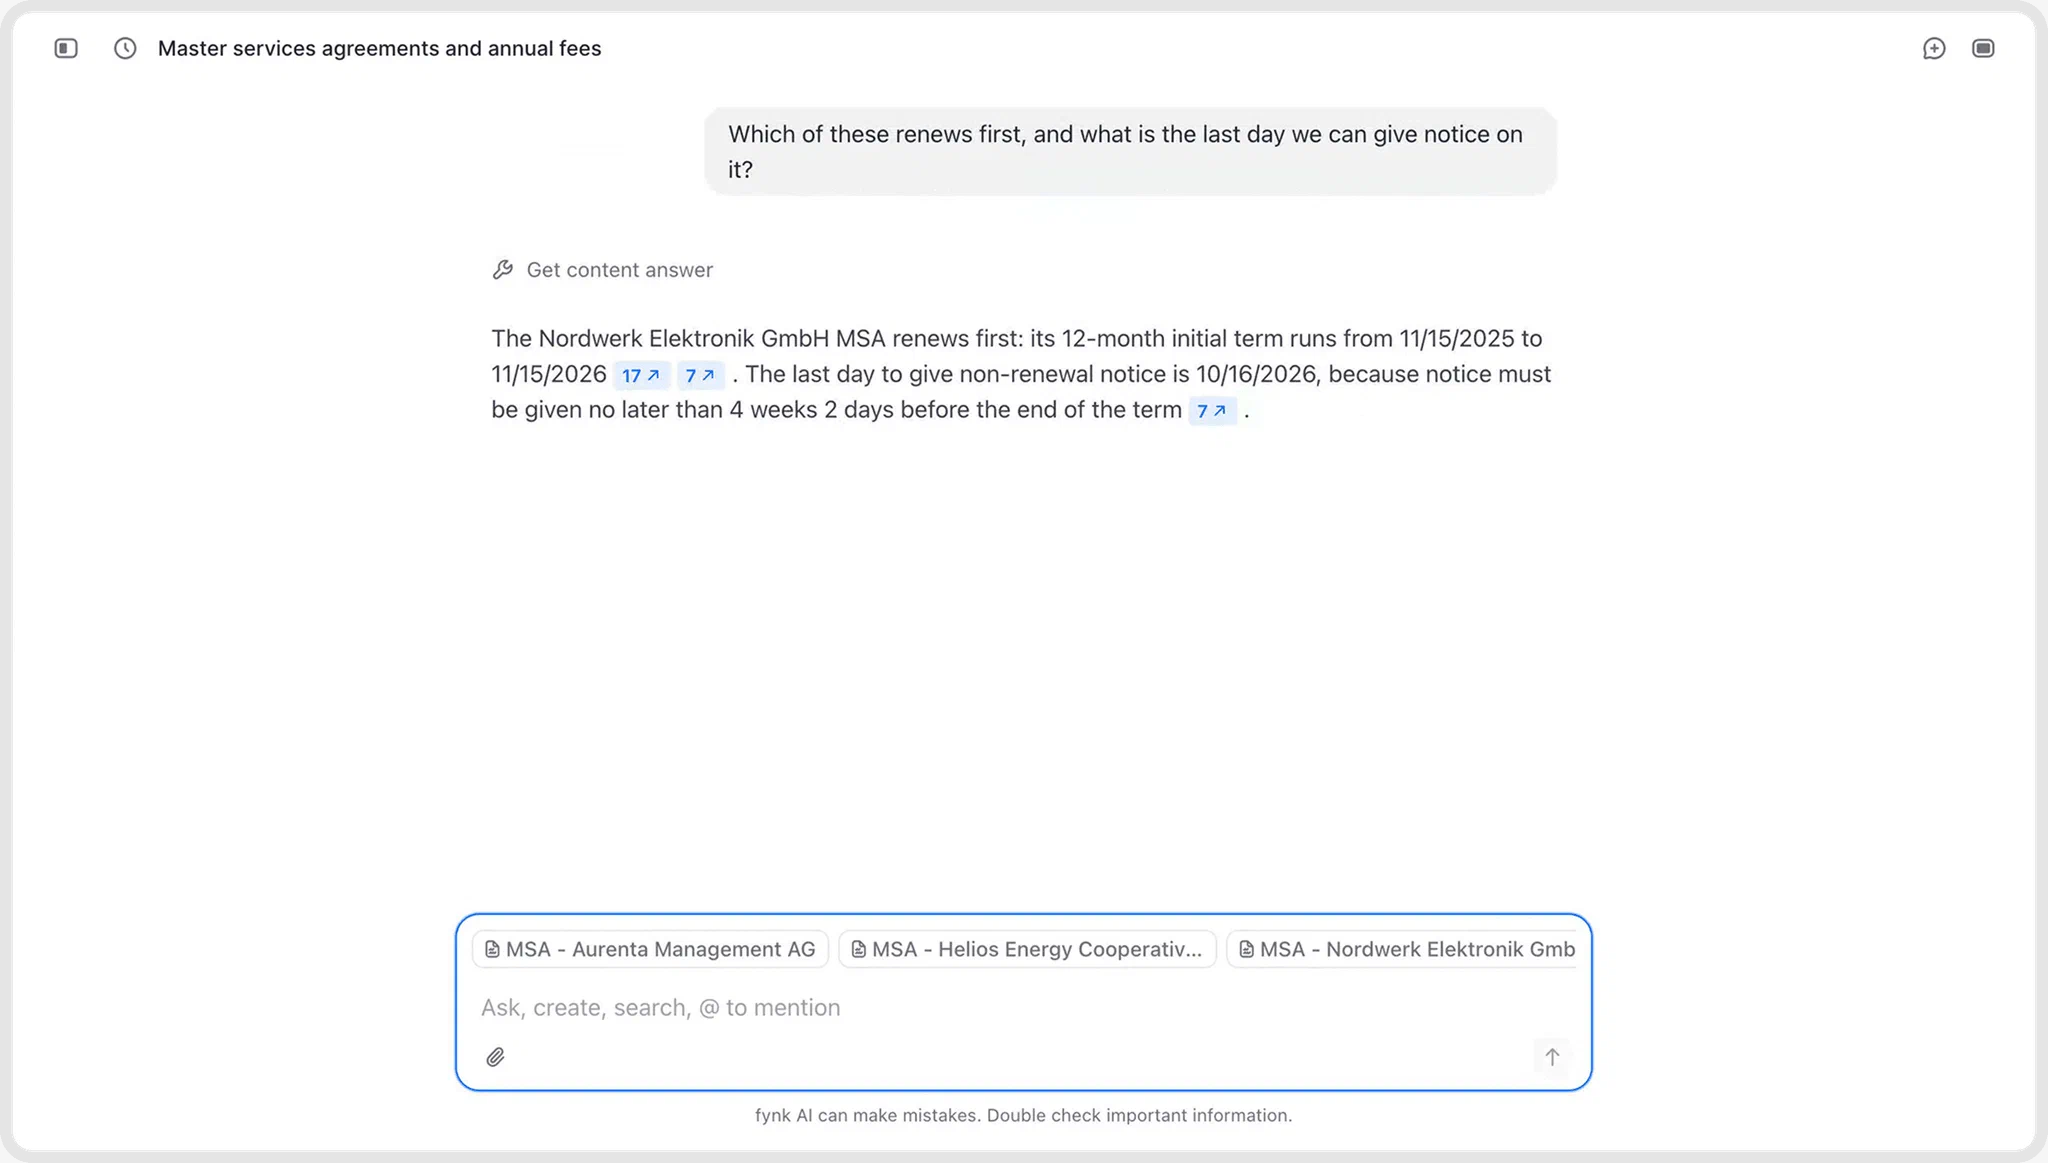
This measures whether renewal decisions and any required actions happen before the contract’s notice deadline. A higher rate is better because the team has acted while its options are still open. “Handled” means a documented decision plus any required action, such as sending notice, rather than merely opening the reminder.
How to measure: Divide renewals handled before their notice deadline by all renewals whose notice deadline fell during the period, then multiply by 100.
Data: Contractual notice deadlines, decision records and evidence of any required action.
3. Missed or late obligations
This KPI tracks commitments completed late or still incomplete after their due date. A lower rate is better, whether the obligation belongs to your team or the other party. Separate those responsibilities in reporting so a supplier’s late delivery doesn’t look like your finance team’s missed payment.
How to measure: Divide obligations due during the period that were completed late or remain overdue at the reporting date by all obligations due during that period, then multiply by 100.
Data: Obligation descriptions, responsible parties, due dates, completion dates and supporting evidence.
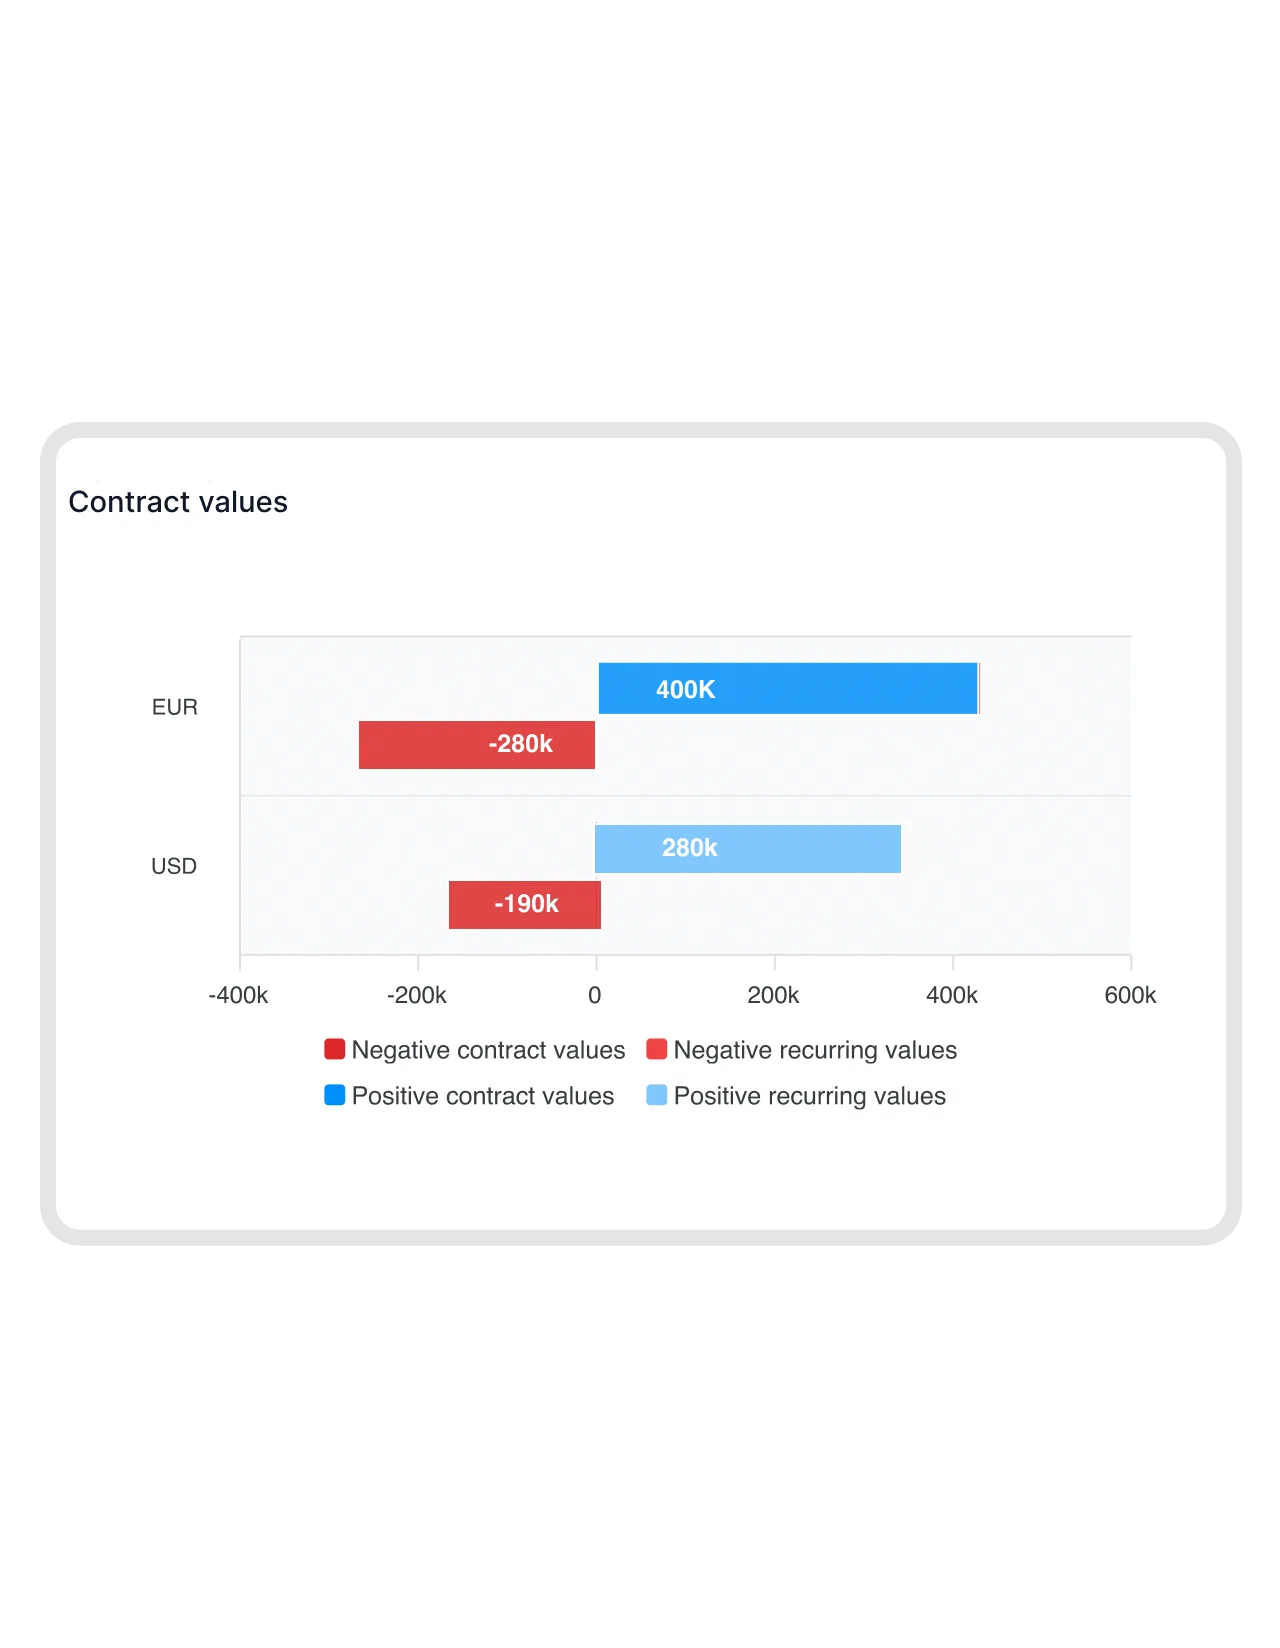
4. Contract value under management and by stage
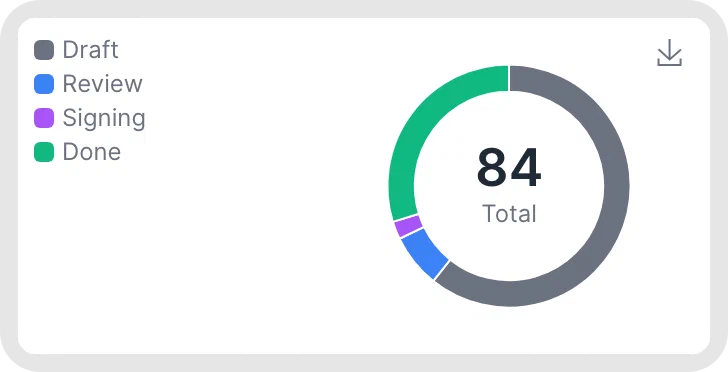
Contract value under management is the total recorded value of the active signed agreements you track; value by stage shows amounts still in drafting, approval or signing. There’s no universal upward target: more sales value and more supplier commitments mean different things. Look for complete value coverage and investigate amounts stuck in a stage, keeping currencies, customer and supplier contracts, and annual versus total values separate.
How to measure: Add the recorded values of active signed contracts for the portfolio total; separately, add the values of contracts in each current stage.
Data: Contract value, currency, value basis, contract type, active status and current stage.
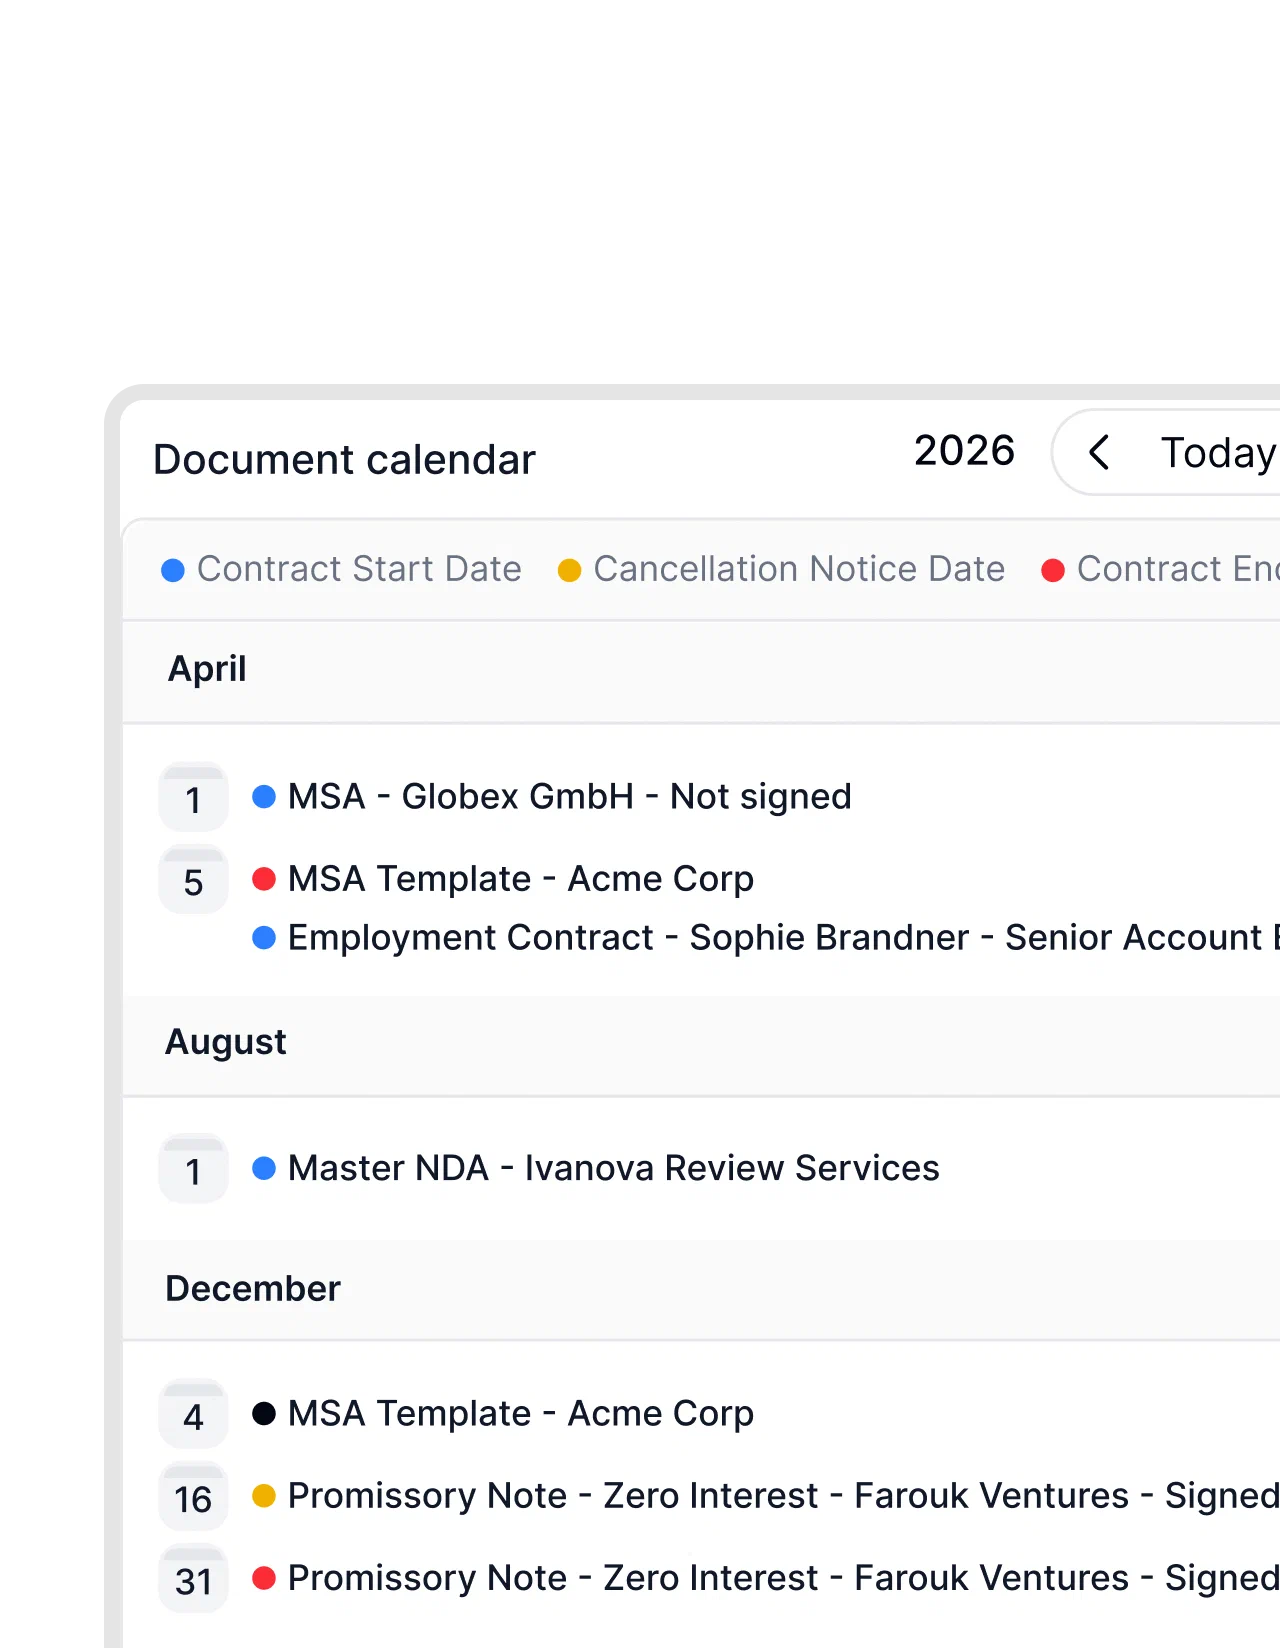
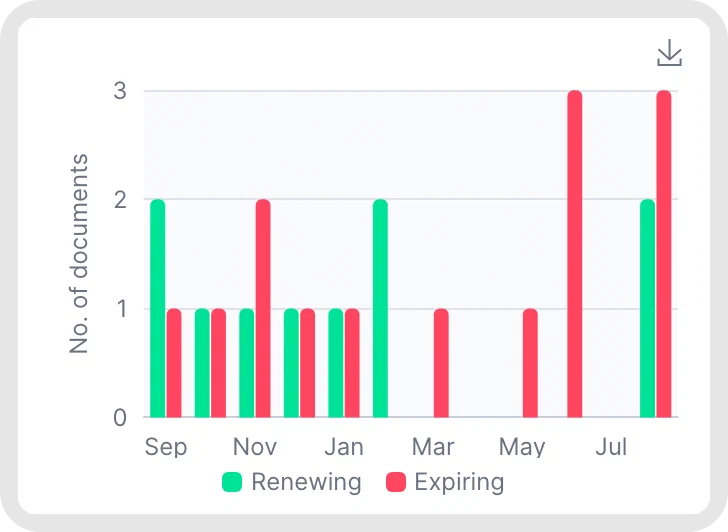
5. Contracts renewing vs. expiring in the next months
This shows how many contracts are due to renew or expire each month. It gives your team a renewal pipeline, so a wave of renewals doesn’t arrive as a surprise.
How to measure: Count contracts due to renew and contracts due to expire in each upcoming month, keeping the two groups separate.
Data: Renewal dates, expiration dates and renewal terms.
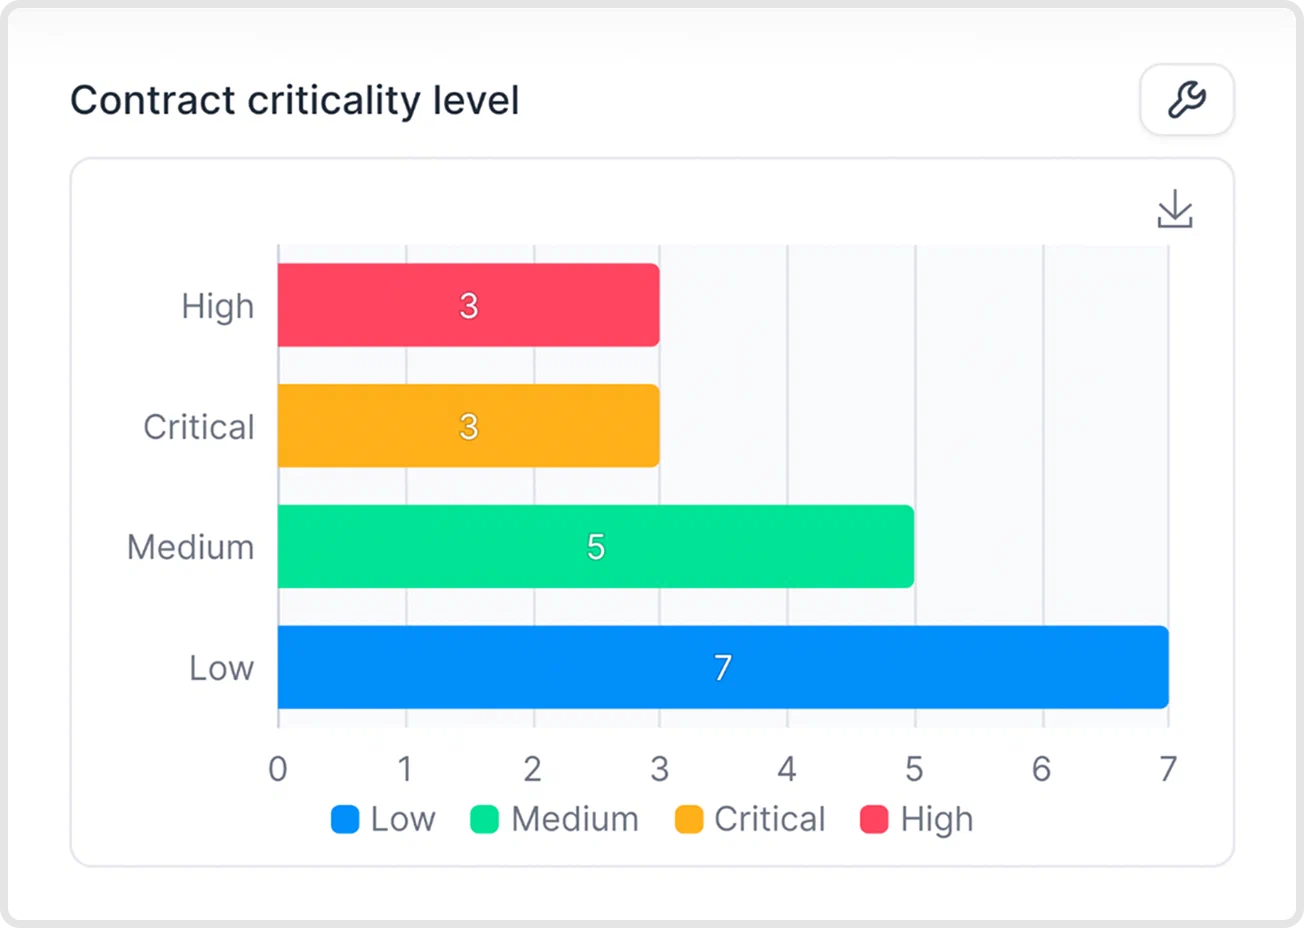
6. Share of high-risk or critical contracts
This shows the share of active contracts rated high or critical. Use your risk score or criticality level to identify agreements that need attention.
How to measure: Divide active contracts rated high or critical by all active contracts, then multiply by 100. Count each contract once.
Data: Active status, risk score or criticality level, and the rating thresholds you use.
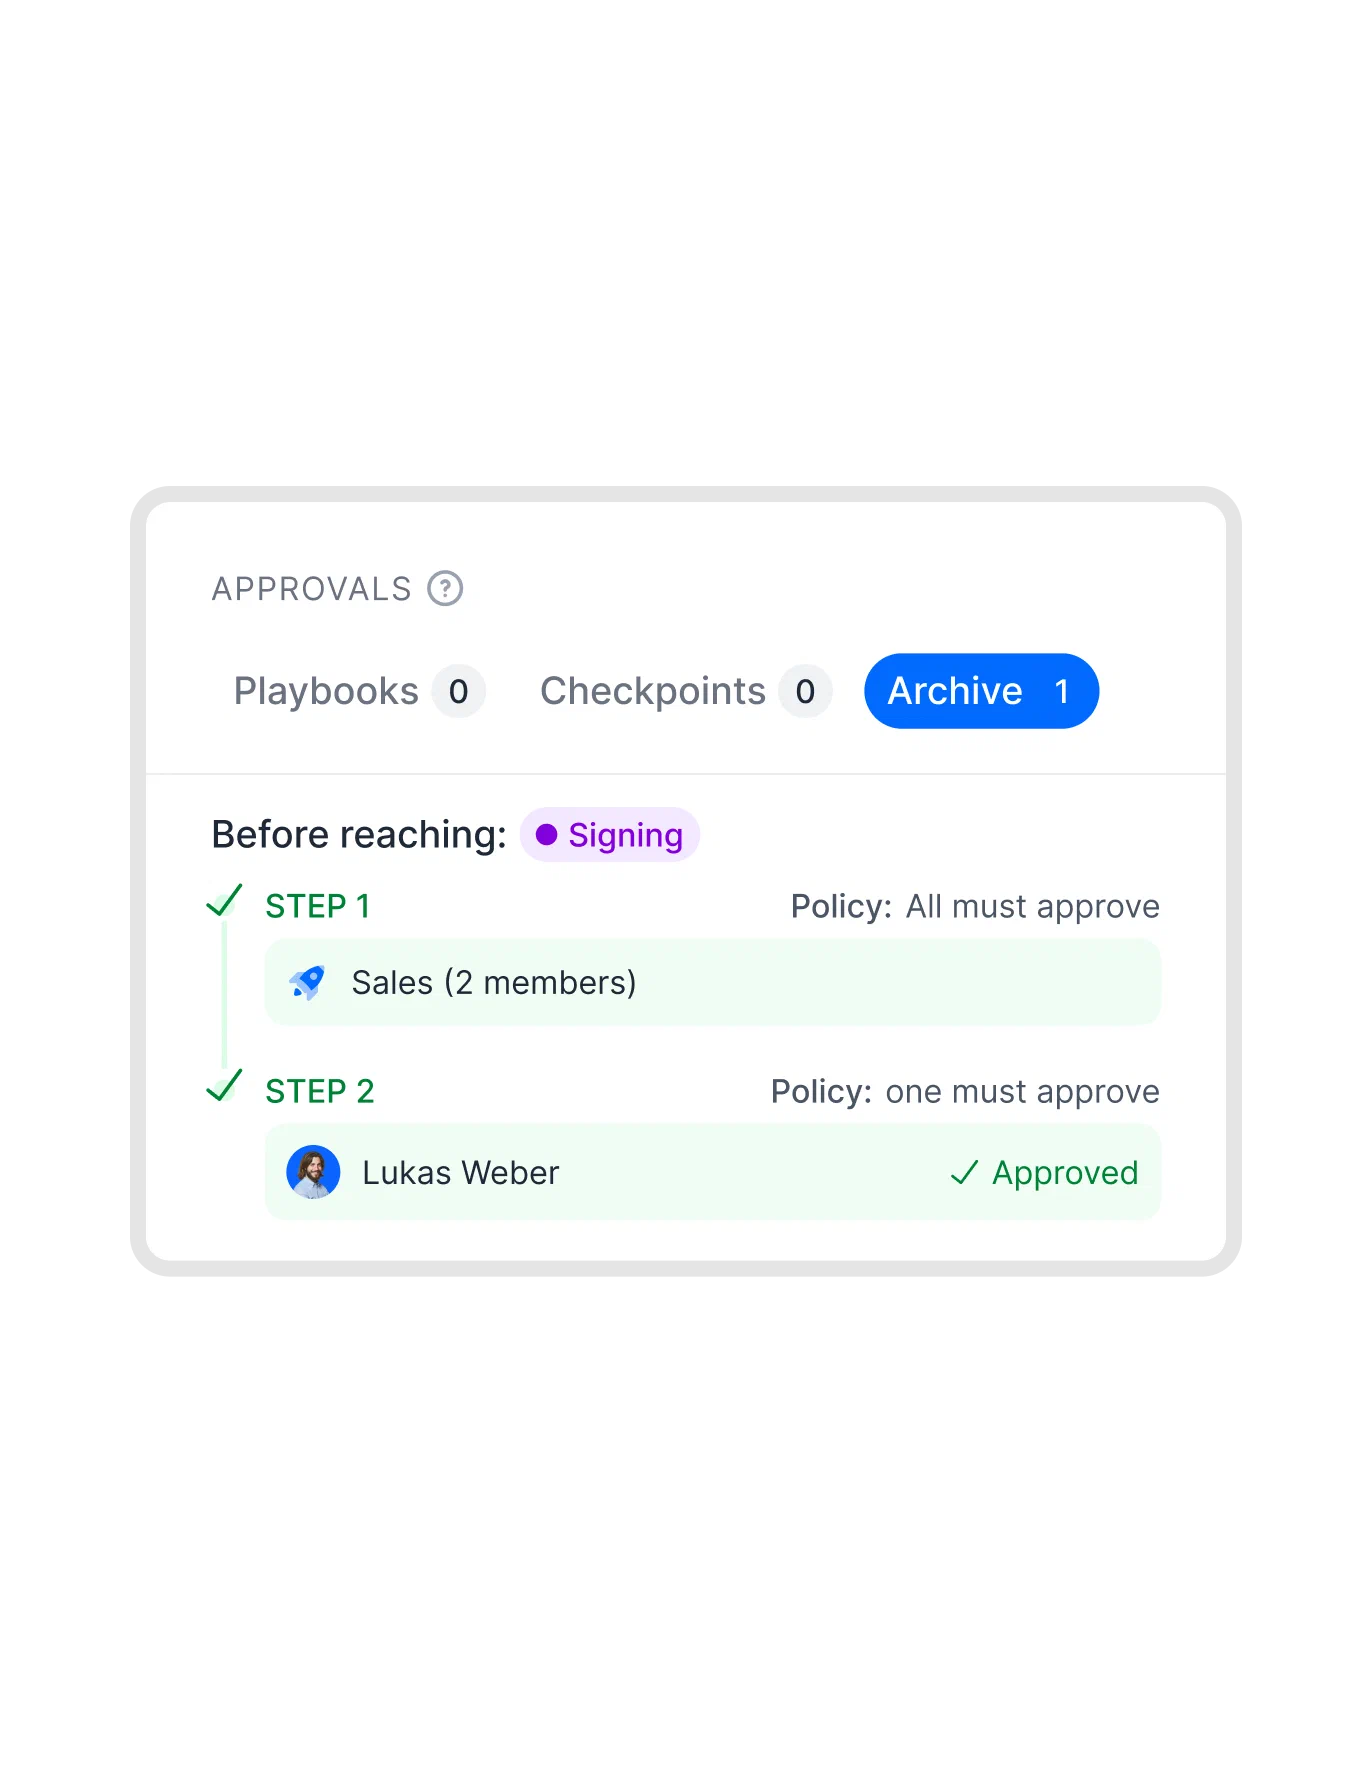
7. Time in approval
Time in approval measures how long a contract spends awaiting internal approval. Shorter waits suggest fewer internal delays; a draft sitting in an approver’s inbox still counts as waiting. Include repeat approval rounds, but don’t double-count overlapping time when approvers review in parallel.
How to measure: For each contract that finished approval during the period, total the elapsed time spent awaiting approval across its rounds, then average those totals.
Data: Approval request and completion timestamps from approval emails or workflow records.
8. Time to signature after sending
Time to signature measures the wait between sending an agreed contract for signature and receiving every required signature. Lower is generally better, so investigate whether delays come from an unavailable signer, incorrect contact details or an unresolved question. Keep this separate from full cycle time: a fast signature can’t fix weeks spent getting the draft ready.
How to measure: Add up the calendar days from sending for signature to final signature for contracts completed during the period, then divide by the number of those contracts.
Data: Sent-for-signature and final signature timestamps from signature records.
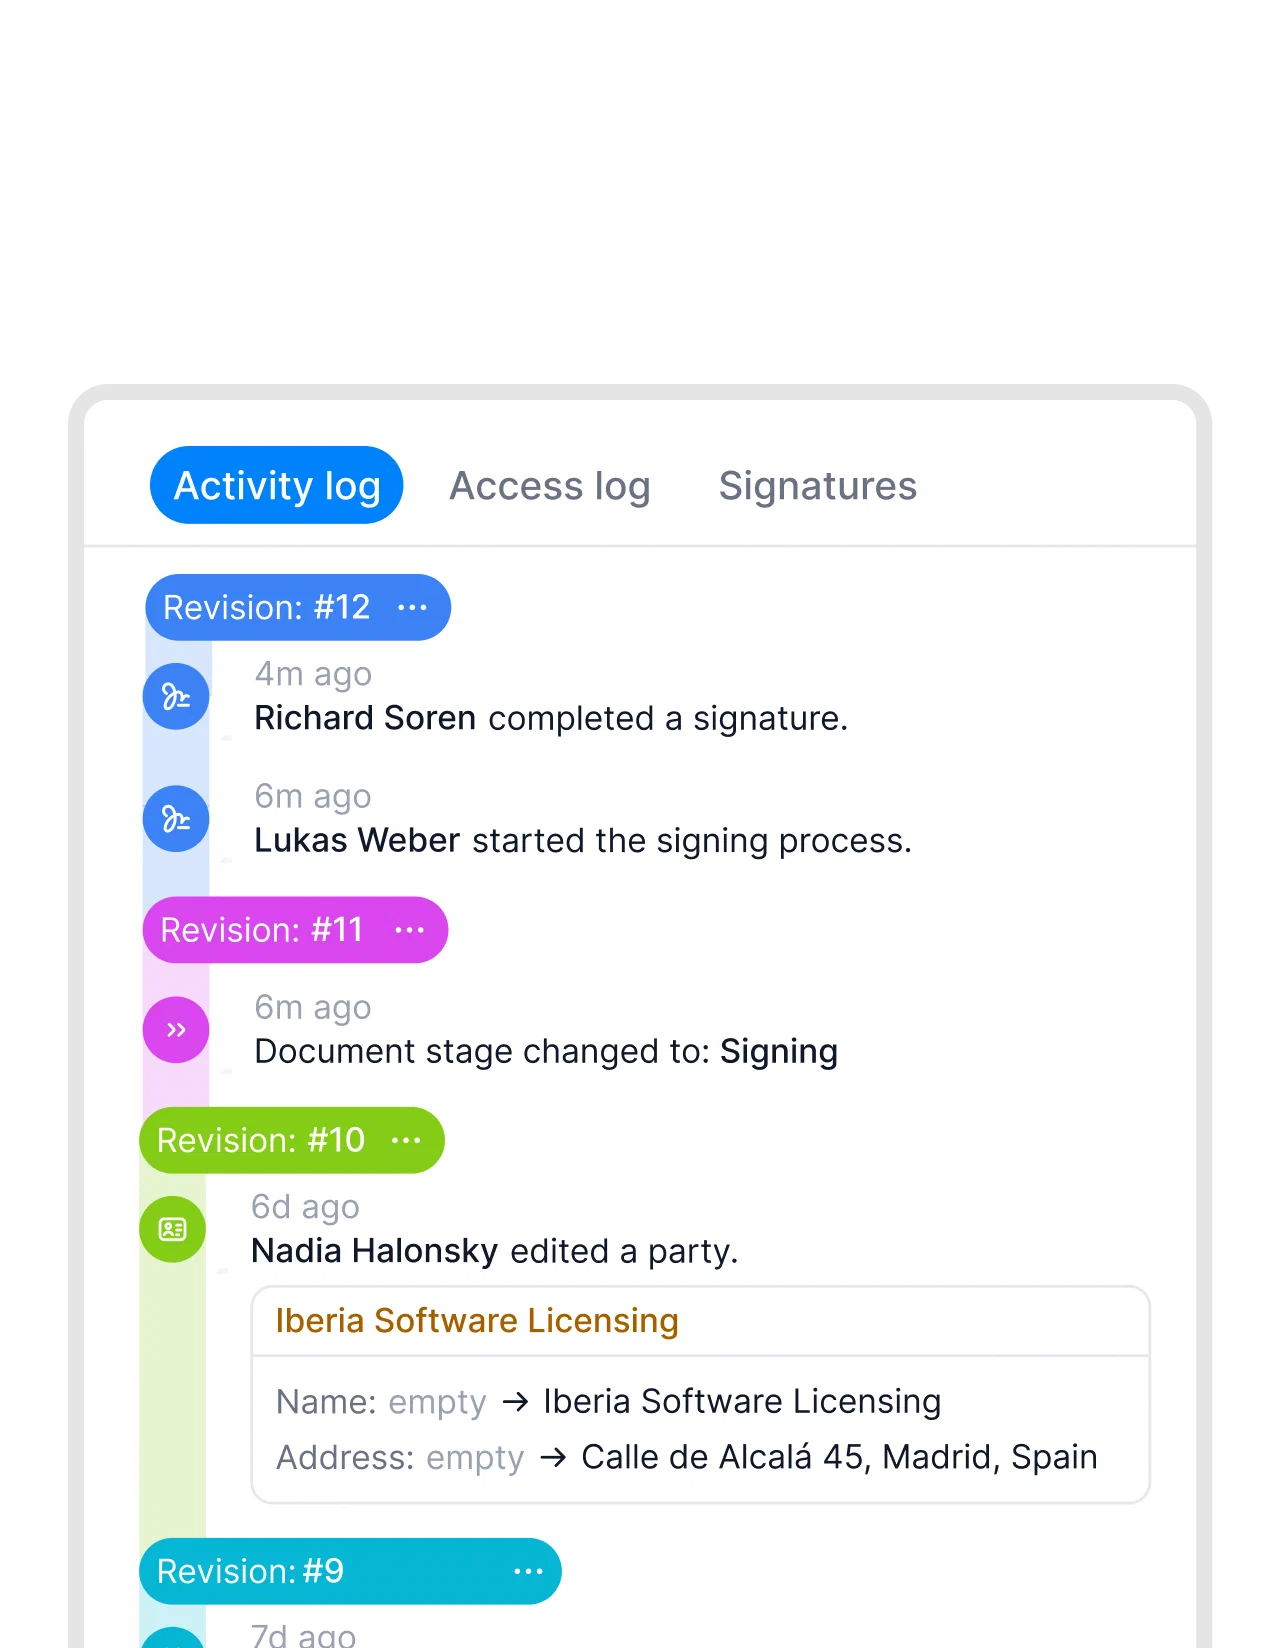
9. Deviations from standard terms
The deviation rate shows how often reviewed contracts contain negotiated clause changes outside your approved wording or fallback positions. A lower rate can mean your standard terms fit the deals better, but necessary exceptions aren’t failures. Record the clause involved so recurring payment or liability discussions don’t disappear into one percentage.
How to measure: Divide contracts that finished review with at least one negotiated deviation by all contracts that finished review during the period, then multiply by 100.
Data: Reviewed drafts, clause comparisons and an exception log that records the final agreed wording.
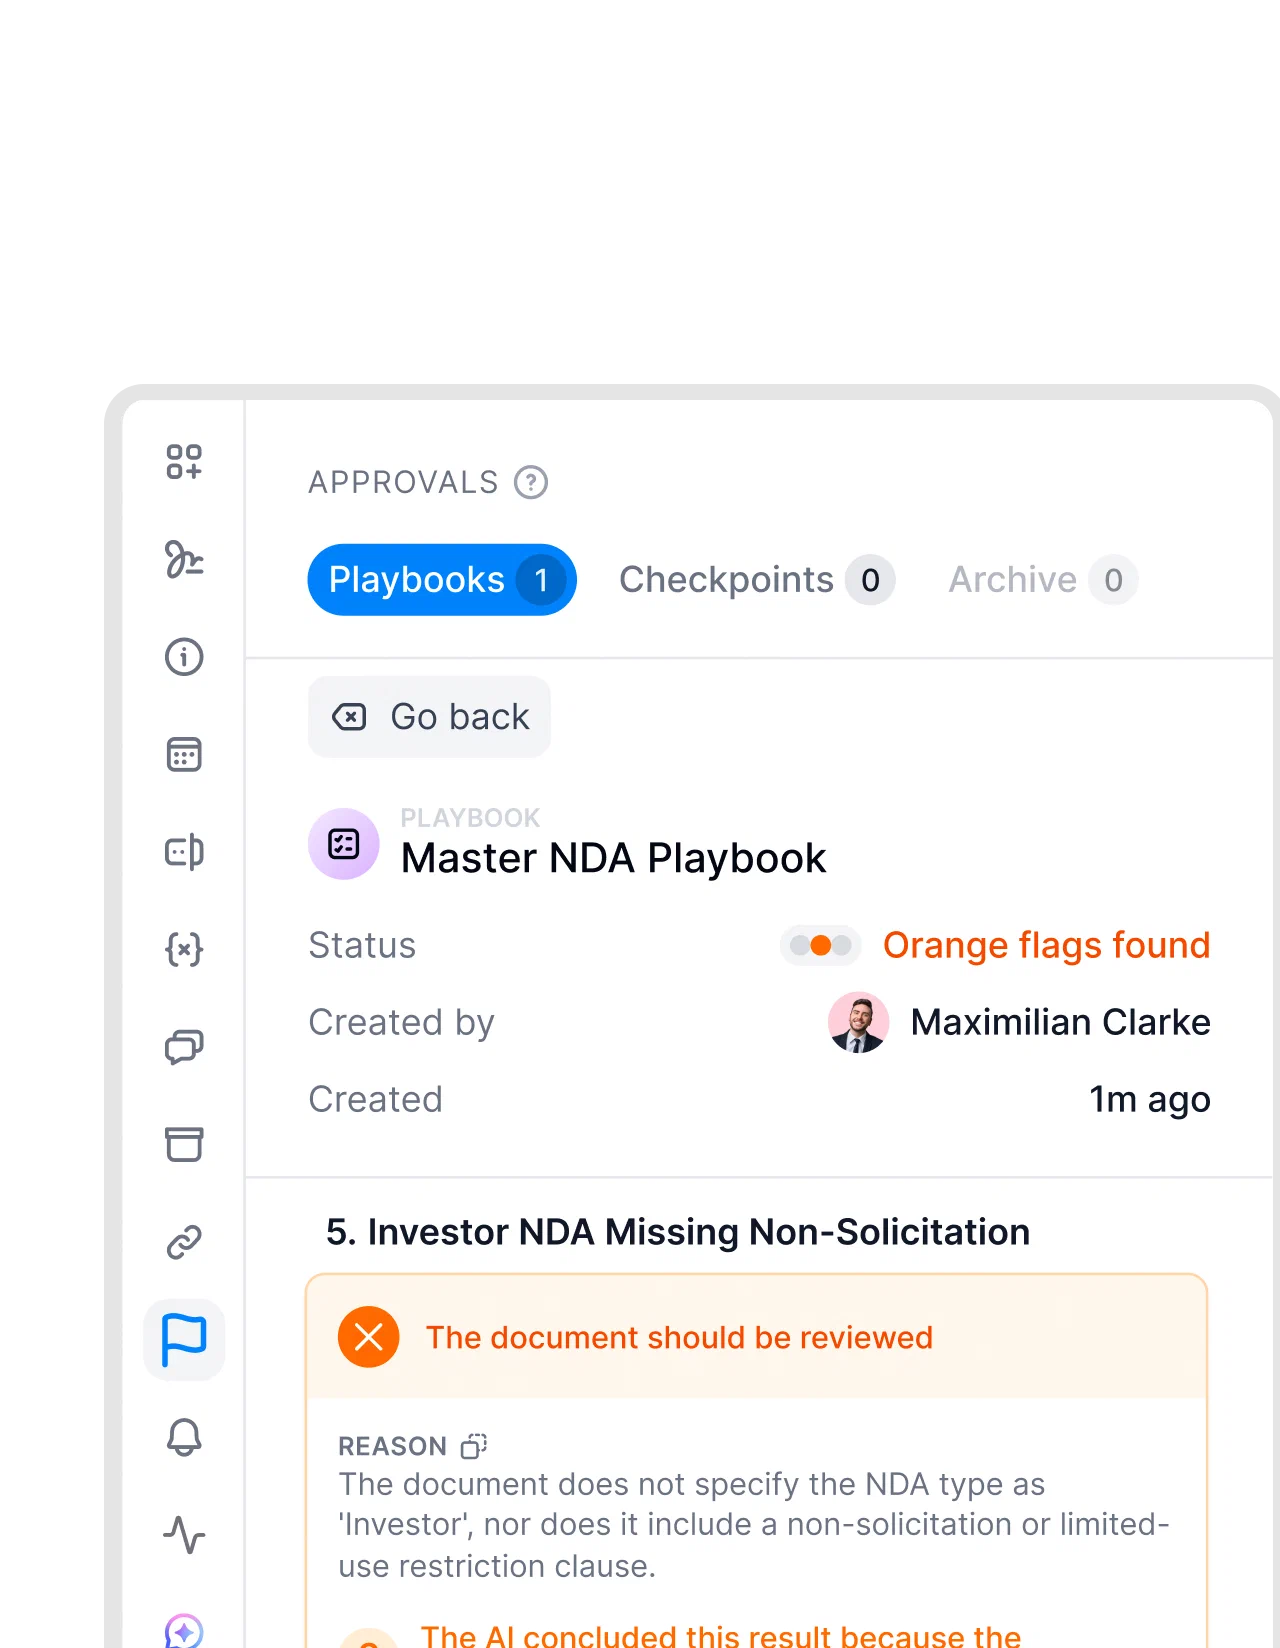
10. Share of contracts on standard templates
This KPI shows how often eligible contracts start from your current approved templates. A higher share means more work begins with wording your team has already reviewed. Exclude agreements that must use the other party’s paper so the percentage measures a choice your team can actually make.
How to measure: Divide eligible contracts created from current approved templates by all eligible contracts created during the period, then multiply by 100.
Data: Template name, version and eligibility recorded when each draft is created.
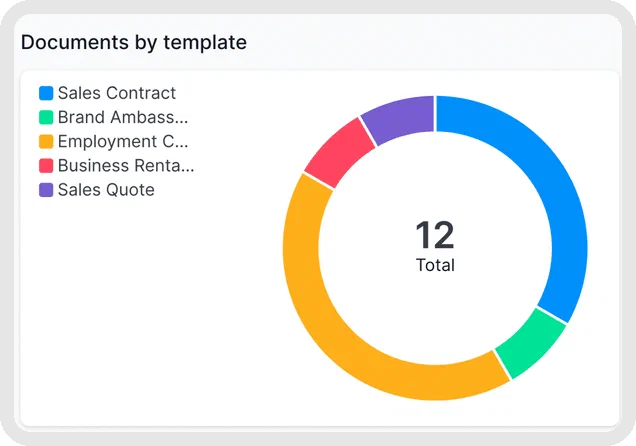
11. Annual spend by supplier
Annual spend by supplier shows your total yearly commitment to each supplier. It helps you spot supplier concentration when much of your spend sits with the same company.
How to measure: Add the committed spend for each supplier for the reporting year, keeping currencies separate.
Data: Supplier name, committed payment amounts, payment schedule, currency and reporting year.
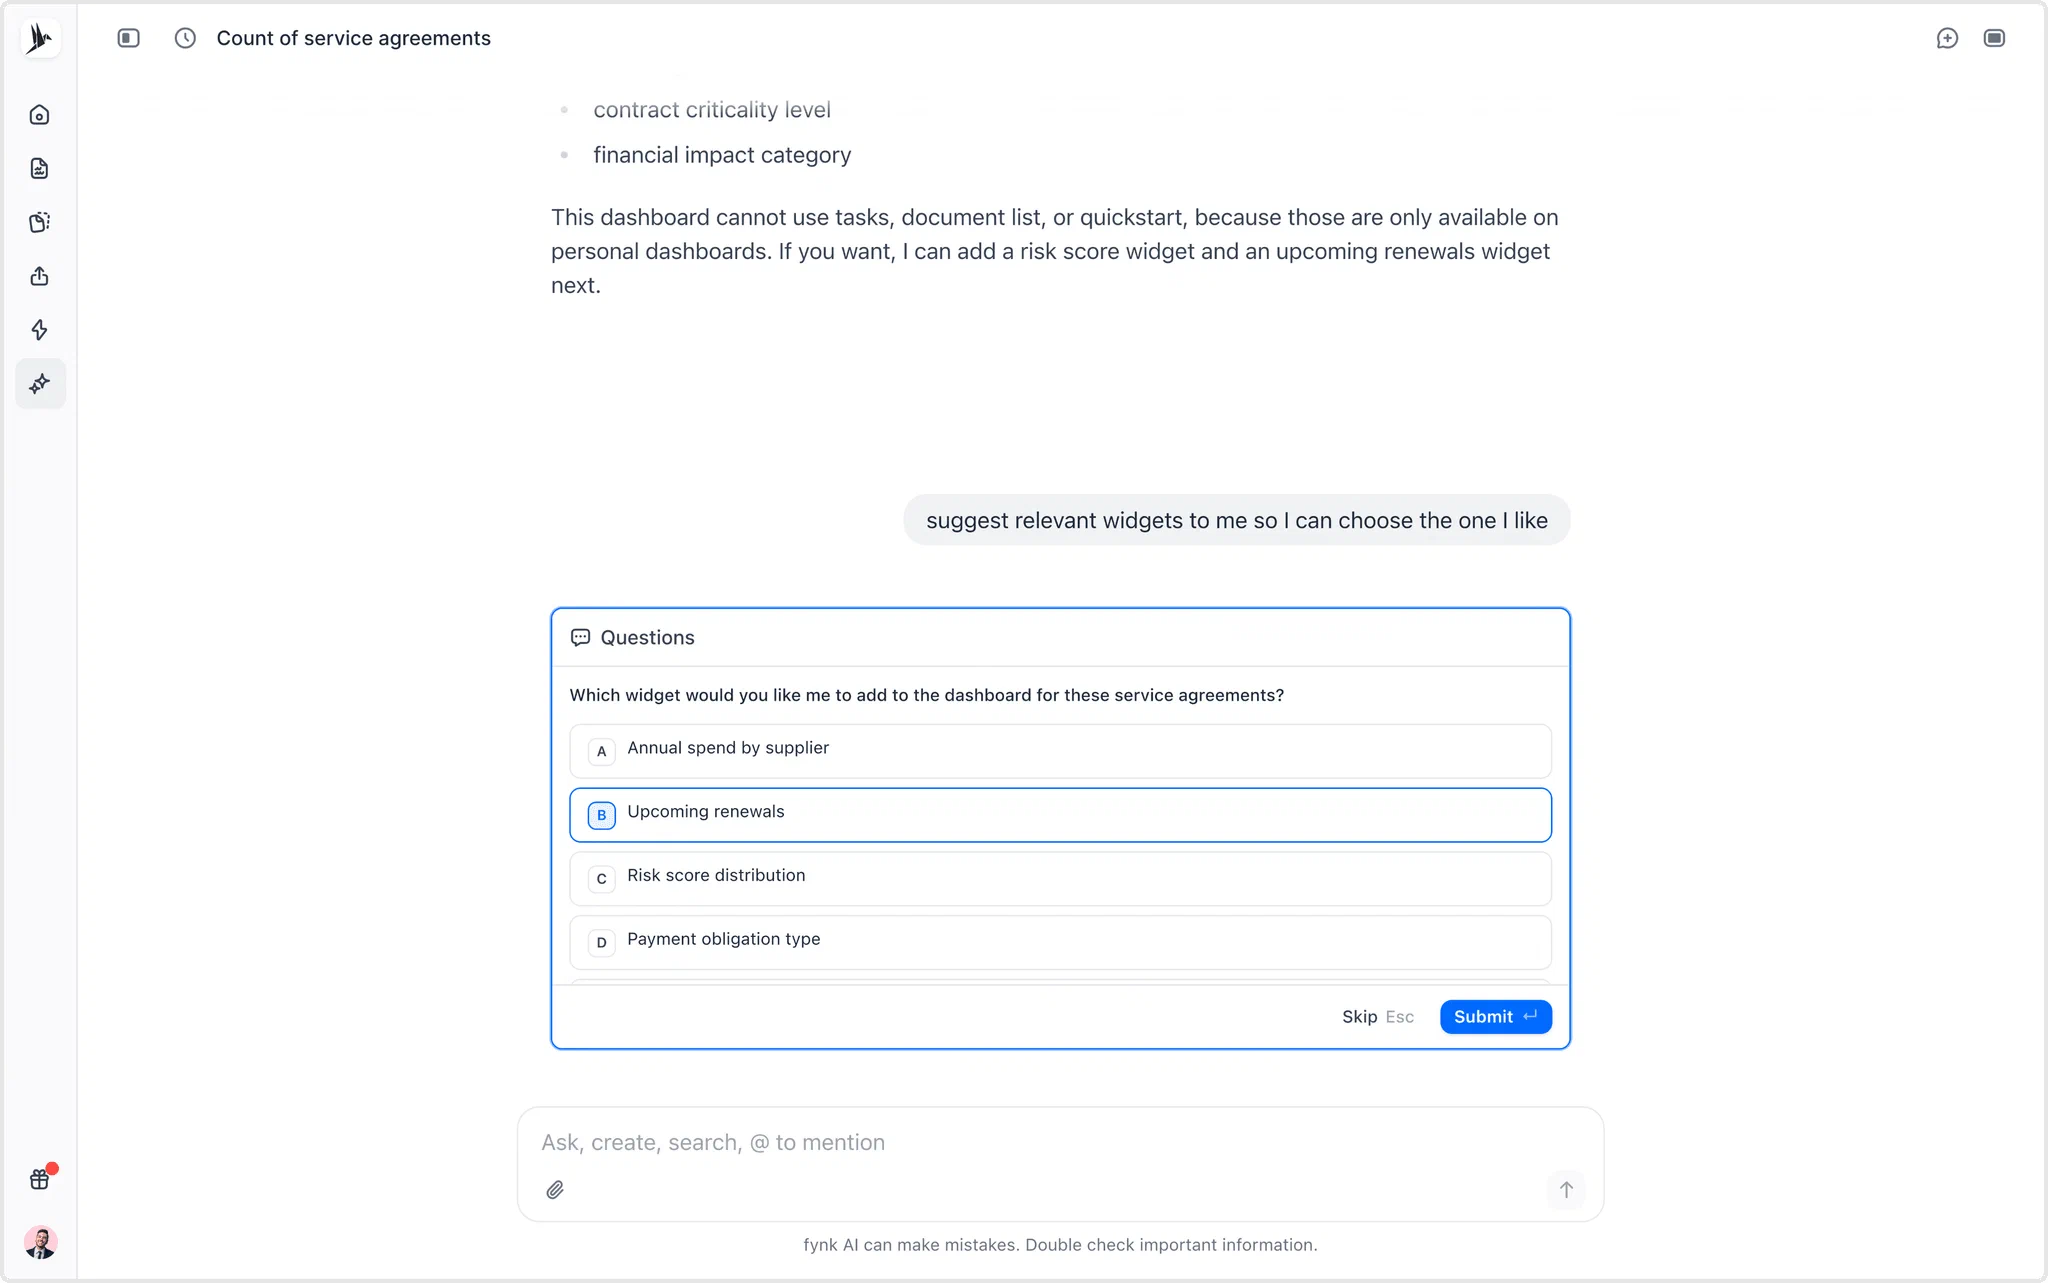
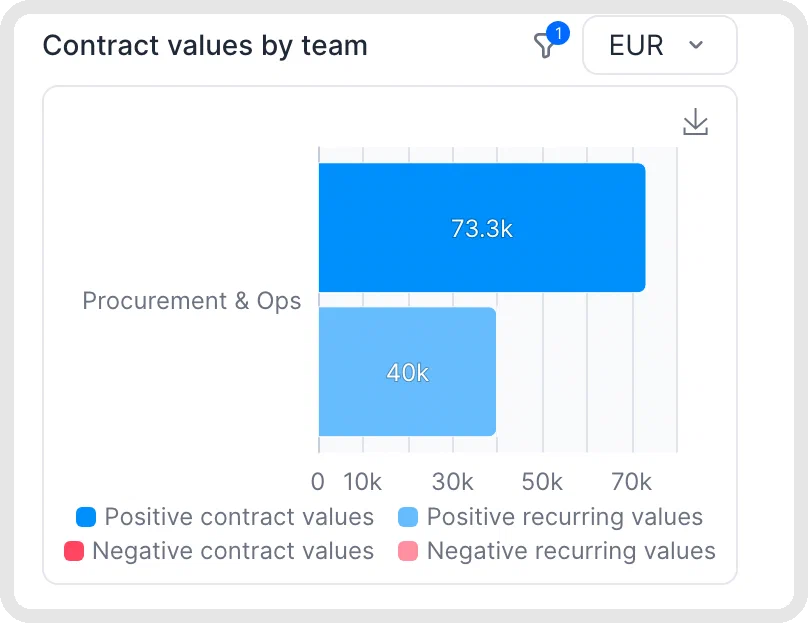
12. Contract value by team and contract type
This shows where the money sits across teams and contract types. Teams working across countries compare values per currency and can build a dashboard per country or legal entity using teams or tags.
How to measure: Add contract values by team and contract type. Keep currencies and annual versus total values separate.
Data: Contract value, currency, value basis, team, contract type and country or legal entity tags.
13. Signed vs. created contracts
This compares contracts fully signed in a period with contracts created in that period. It shows how much work gets finished alongside how much new work arrives.
How to measure: Compare the number of contracts fully signed during the period with the number created during the same period.
Data: Contract creation dates and final signature dates.
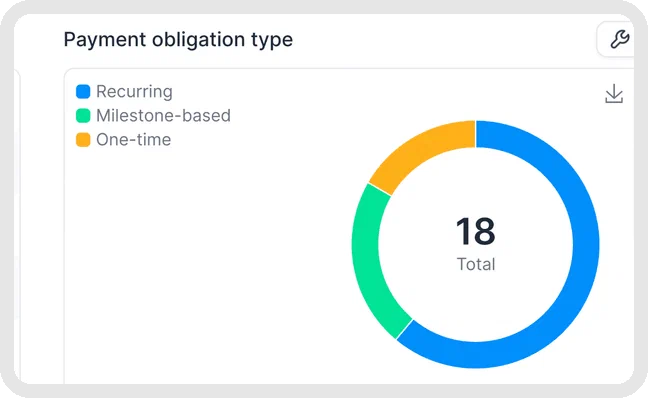
14. Payment obligation types
This shows the mix of recurring, milestone-based and one-time payments in your contracts. It helps your team see which payments repeat and which depend on a milestone or a single due date.
How to measure: Group payment obligations by type. Divide each group’s count by all recorded payment obligations, then multiply by 100.
Data: Payment obligation type, linked contract and payment schedule.
15. Contracts per counterparty
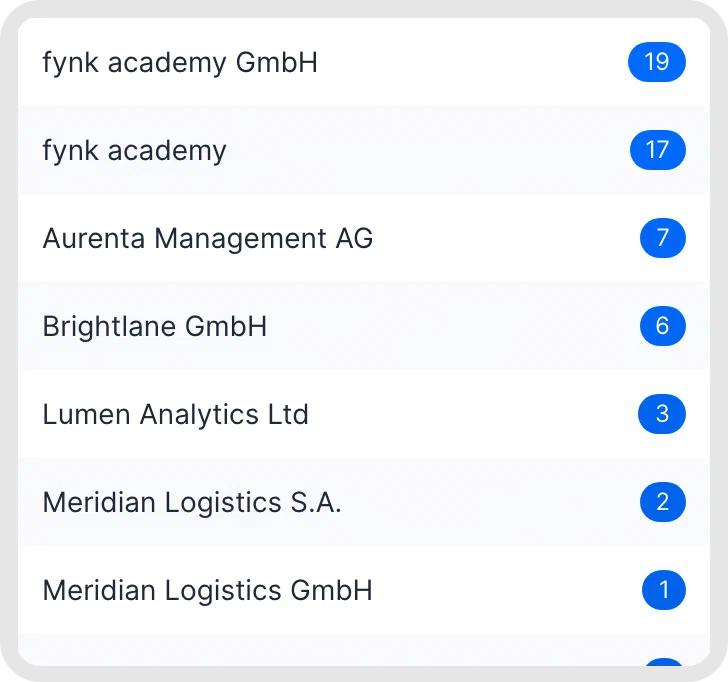
This counts how many active contracts you hold with each party. It shows where several agreements sit behind the same business relationship.
How to measure: Count active contracts for each counterparty.
Data: Counterparty name, contract identifier and active status.
16. Average renewal duration
Average renewal duration shows how long contracts renew for on average. Compare it by contract type to see the length of the commitments you’re extending.
How to measure: Add the renewed term lengths for contracts renewed during the period, then divide by the number of those contracts. Calculate this by contract type using the same time unit.
Data: Renewal term length, renewal date and contract type.
How do you build a contract management KPI dashboard in fynk?
You build a contract management dashboard in fynk with dashboards, which pull your contracts, dates and tasks into one view. Analytics and reporting work at three levels:
- Personal dashboards: Your own contracts and tasks.
- Team dashboards: The shared workload of one or more teams.
- Account dashboards: An overview of the whole contract portfolio.
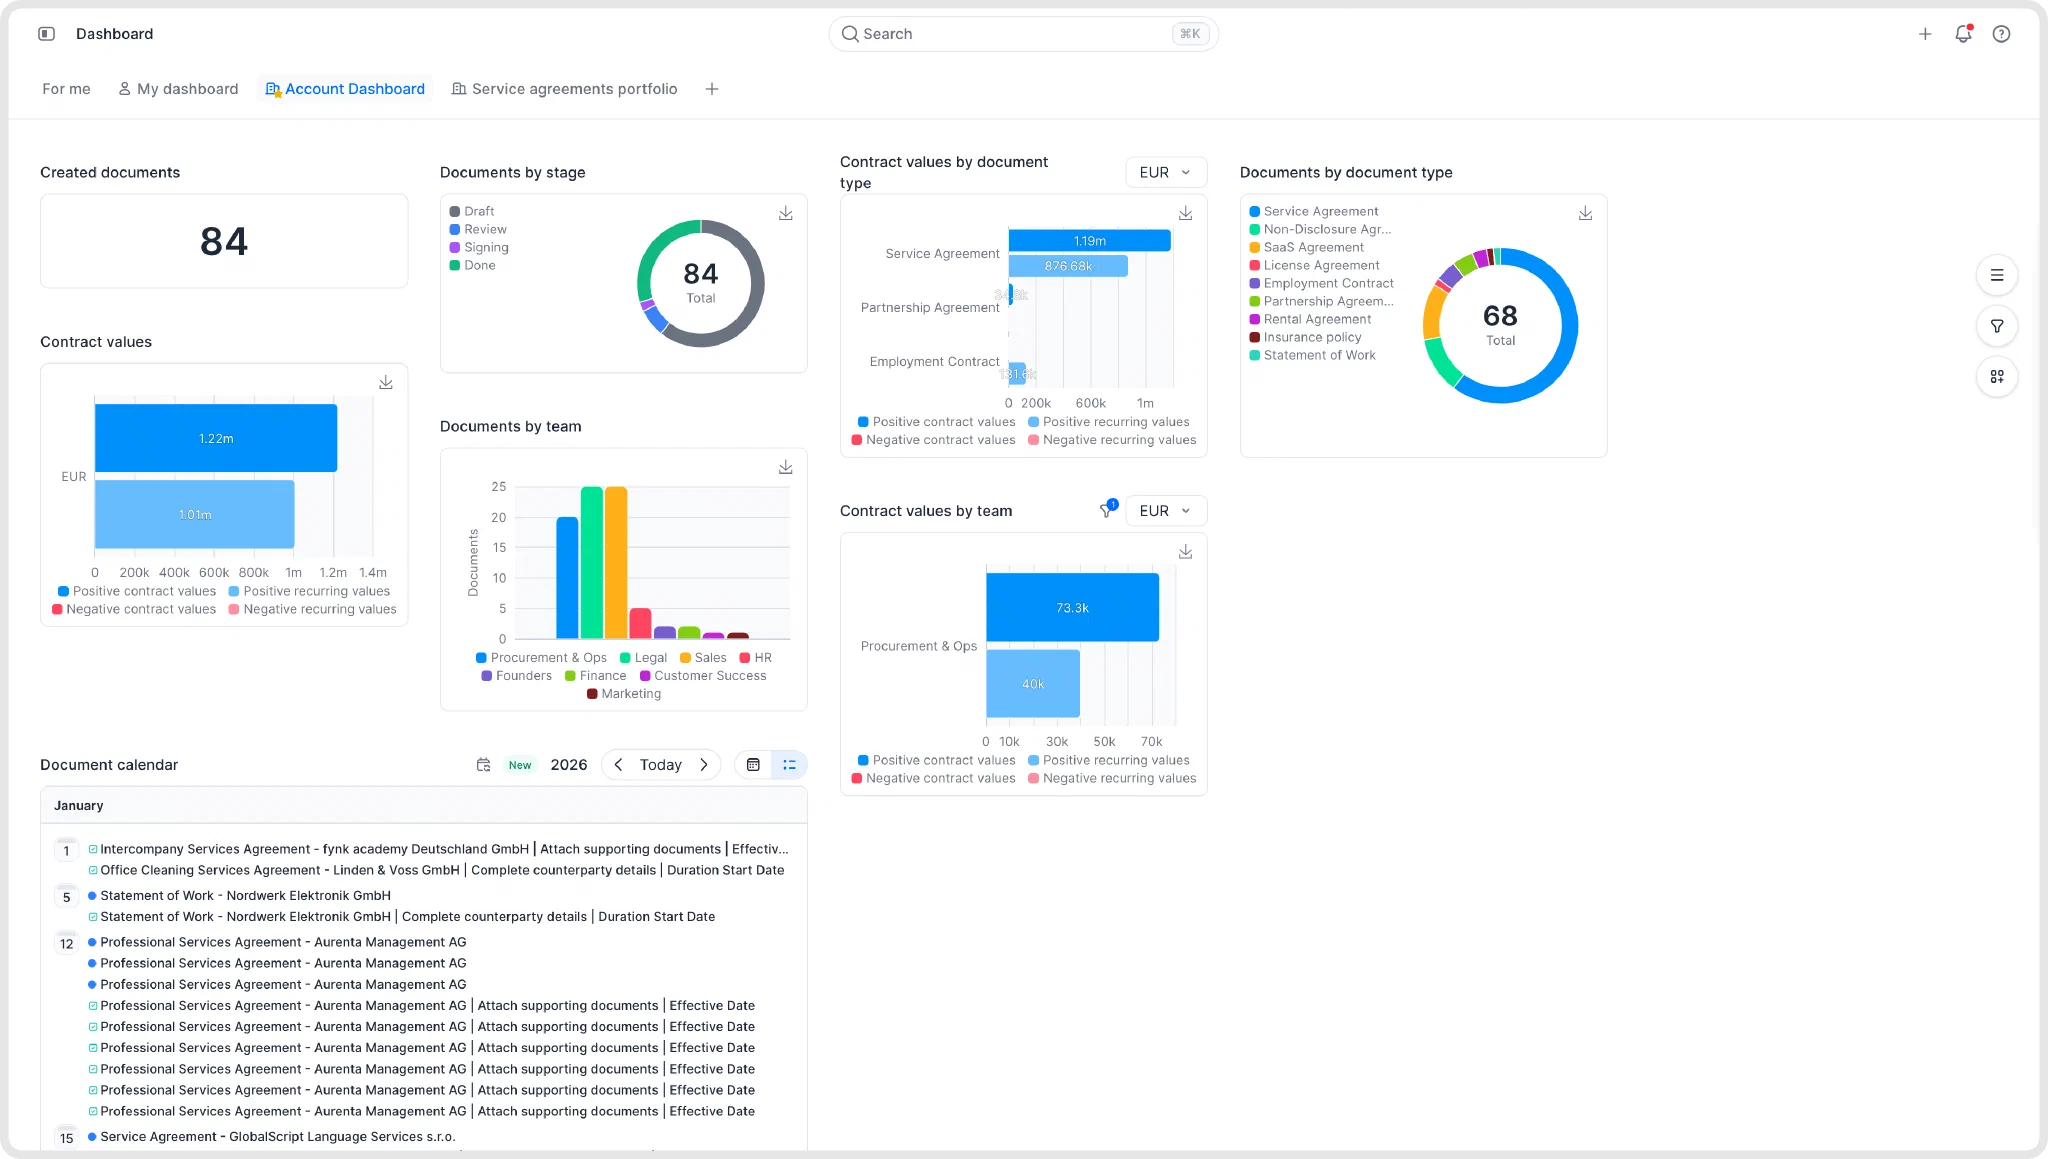
Visibility follows user roles, so people only see what they’re allowed to.
You can also build a dashboard for one type of agreement, such as your service agreements portfolio. Filter by stage, team, tags, document type and creation date. That keeps the review focused on the agreements you want to discuss.
International teams can build a dashboard per country or legal entity using teams or tags, with contract values shown per currency. That helps them see what’s blocked in each country.
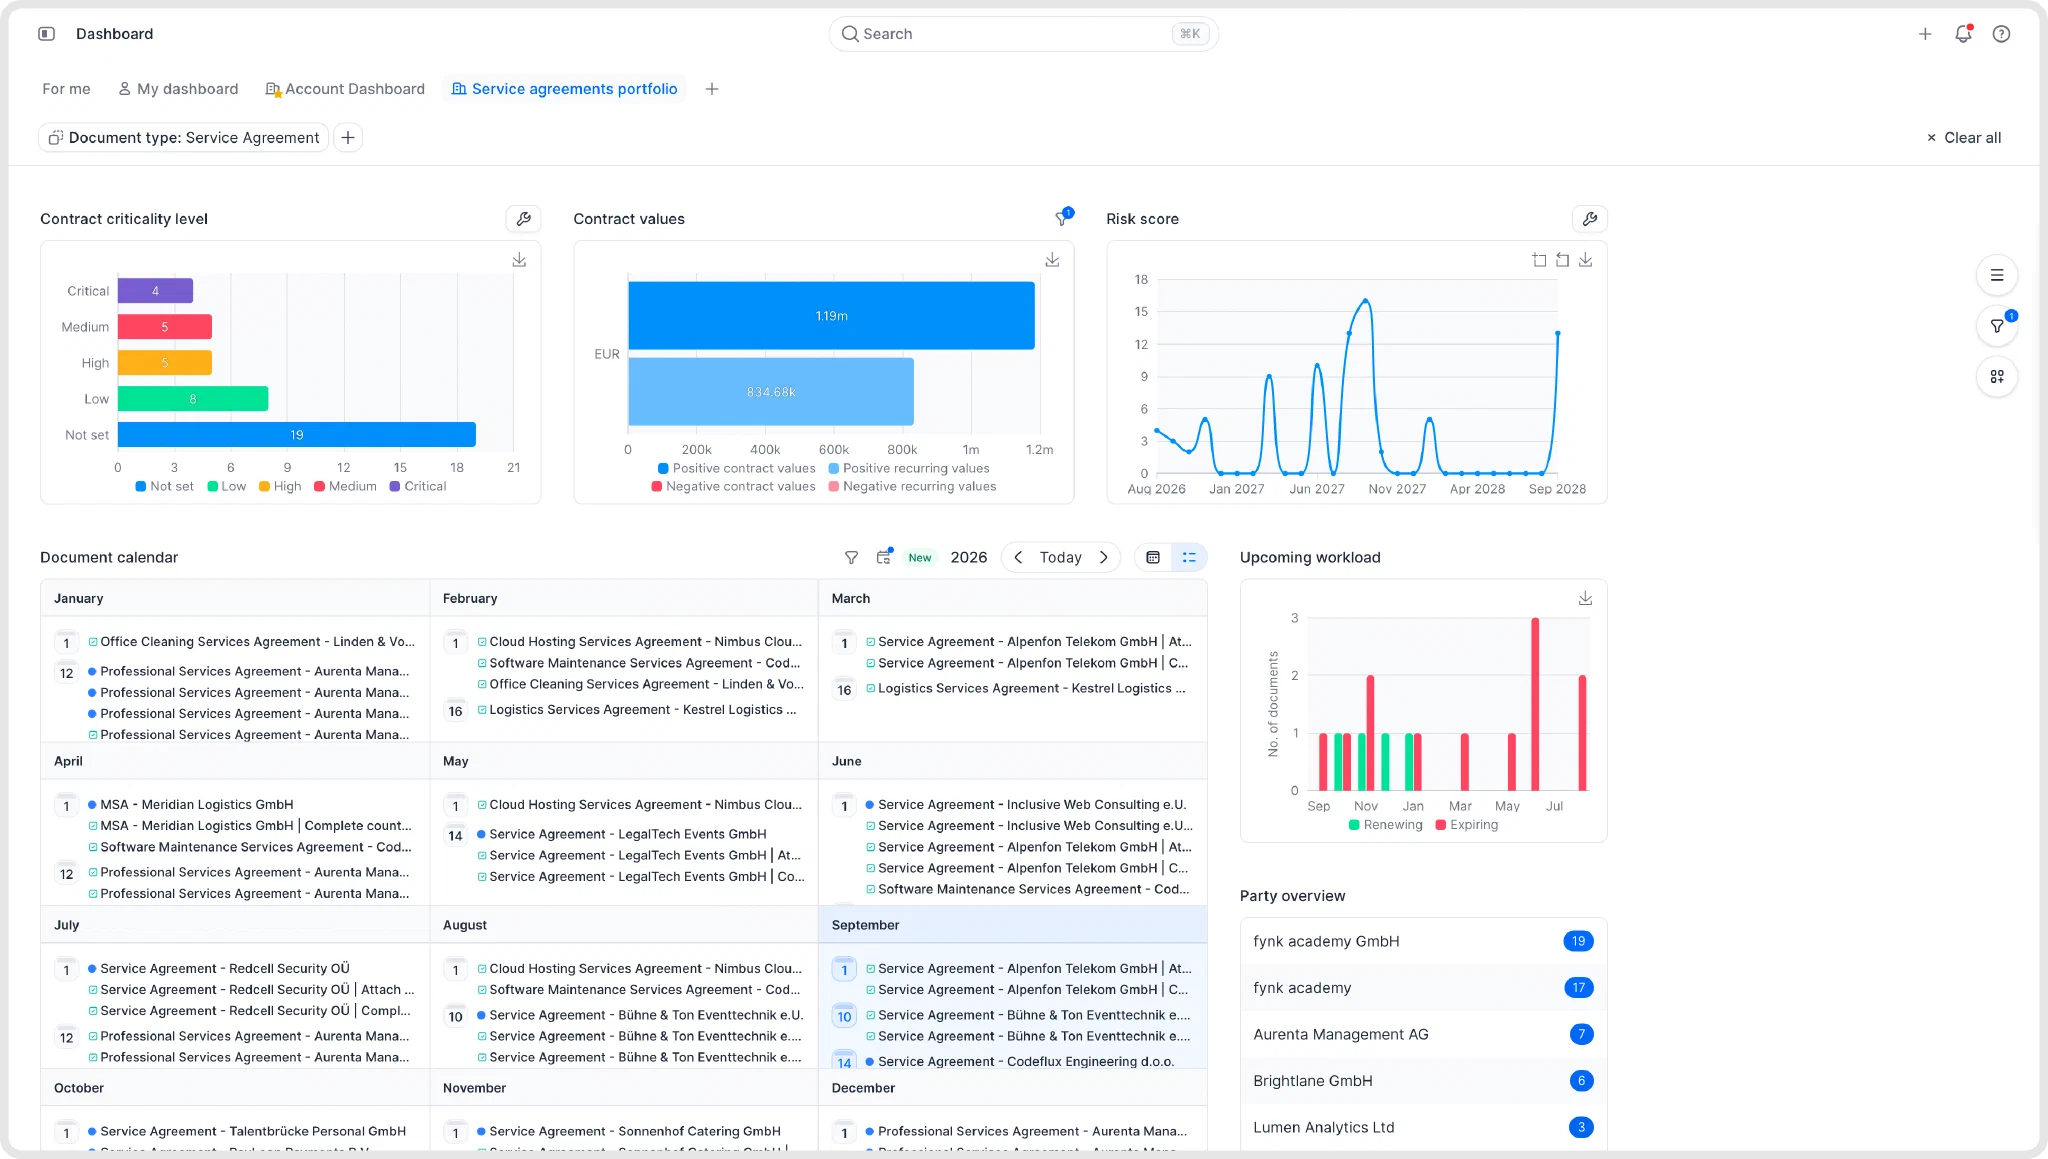
The data comes from what’s already in fynk: metadata, tags, contract types, tasks, templates and document activity. That means the monthly review starts with the contract information your team already maintains. Nobody needs to rebuild a spreadsheet first.
You can also ask fynk AI to build the view for you. To create a dashboard with AI, describe the agreements it should cover and what you want to track.
At fiskaly, legal and C-level teams defined a focused set of KPIs and track them in fynk dashboards. They answer practical questions: What’s blocked in which country? How many SLAs are active? What was signed last week?
We keep it simple with five to ten KPIs that really matter in a contractual relationship.

1. FC Nürnberg handles its busy periods with reminders and dashboards instead of Excel files. The same overview brings contracts and deadlines together when the workload grows.
The complete picture of your documents.
In one screen.
How do you start tracking contract KPIs in fynk?
Start tracking contract KPIs in fynk with three measures, reliable fields and a monthly review.
- Pick three KPIs for one goal. Tie them to your contract management strategy.
- Make sure the fields exist. Use contract metadata practices to keep metadata consistent. Link tasks and reminders to each contract.
- Set a baseline from last quarter. Calculate each KPI from those records. Flag gaps before comparing results.
- Review monthly in your fynk dashboard. Act on one number. Assign an owner and a date to check progress.
Use measured working hours saved in the ROI calculator to estimate their value.
Contract management KPI FAQs
A practical starting set is contract cycle time, renewals handled before the notice deadline, missed or late obligations, contract value under management, and contracts renewing or expiring in the next months. Together they cover speed, risk and value. Choose the measures that match your business goal, and start with three if collecting reliable data is still new.
Measure elapsed time from the initial contract request to the final required signature. Add those durations for contracts fully signed during the reporting period and divide by the number of those contracts. Use the same day-counting rule throughout, separate contract types and show unfinished contracts separately.
A good contract cycle time depends on the contract type, complexity, negotiation and required approvals. Compare similar agreements against your own baseline rather than adopting an industry number. Aim to reduce avoidable waiting while maintaining the review each agreement needs.
Keep the report focused on the business goal and your selected KPIs. Show the reporting period, baseline, current result, direction of change and number of records behind each measure. Explain significant changes, flag missing data and name the owner and next action for the issue that needs attention.
Choose one goal and three KPIs. Bring the dates, values, owners and follow-up work together in fynk, then review what changed each month. The next time someone asks how long contracts take, you’ll have an answer and a place to start improving it.
Searching for a contract management solution?
Find out how fynk can help you close deals faster and simplify your eSigning process – request a demo to see it in action.
Please keep in mind that none of the content on our blog should be considered legal advice. We understand the complexities and nuances of legal matters, and as much as we strive to ensure our information is accurate and useful, it cannot replace the personalized advice of a qualified legal professional.


Get a regular dose of insightful contract management content


Take control of your agreements. Move your business forward.
Run agreements the way they should run: fast, clear, and on your terms.
No setup headaches
Go live in days, not quarters
No lock-in
Full export anytime
No hidden fees
Signatures included, no envelope fee