The complete picture of your documents.
In one screen.
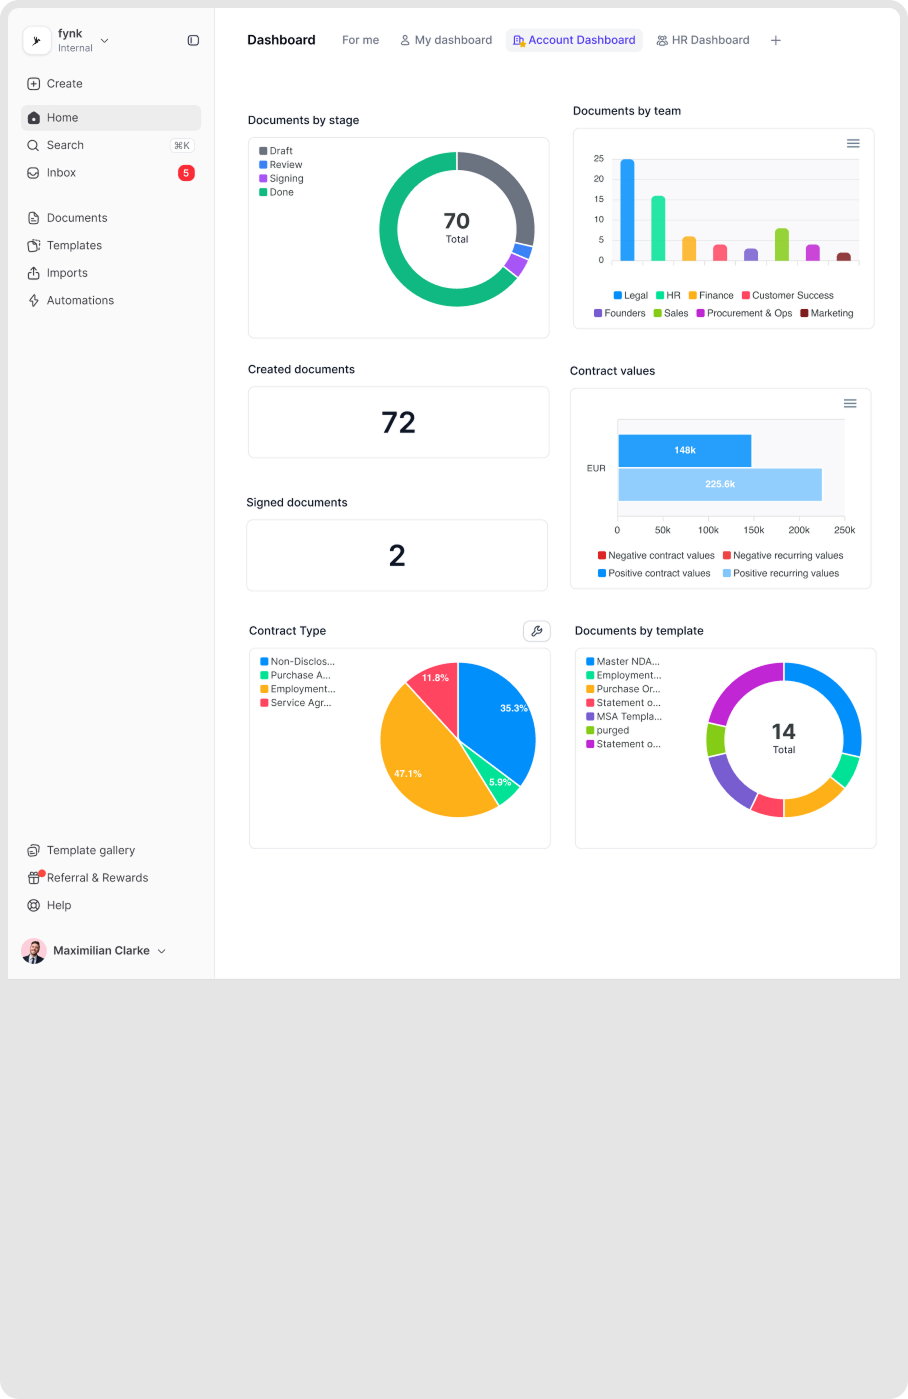
When you zoom in too much, it's easy to lose the bigger picture. Dashboards gives you a bird's-eye view of all your files, so you can quickly see what needs attention. Everything you need is gathered in a single tab, always in sight. Clear numbers. Simple charts. With no manual work.


Everything your contracts hold. Always in sight.
One shared view. Real-time progress. See the status of all that is happening in your contracts with fynk Dashboards.

Document Activity
Get a demoFollow contract changes, without opening each.
Contracts shouldn’t go silent as volume grows. Stop digging through files separately for status updates. fynk Dashboard is your live control panel for every draft, review, and signature. Not a notification feed, but a real-time map of who’s doing what and what’s next. All gathered in one tab."It's now really visible what's happening on the contract side, not just notifications in a chat, but real visibility."
 Lucas F. Jamnig Lead Counsel of fiskaly
Widgets
Get a demoBring important contract data to the surface.
Your dashboard should work the way you do. Build custom views for yourself or your team with widgets. Rearrange, resize, and filter data to bring what matters most on top. Choose how to display it using scoreboards, charts, lists, or calendar views. Always flexible. Always on point."We managed everything in Excel before. Now the dashboard gives us a clear overview of all contracts and deadlines."
 Dr. Jörg Burkhardt Head of Sales & New Partnerships at 1. FC Nürnberg

Visual Workload
Get a demoKeep every contract in sight as you grow.
Don’t lose track of contracts as volume grows. See how contracts are actually distributed without worrying about workload. fynk turns all data into simple visual snapshots you understand just by looking. More contracting, zero blind spots."I always know if a contract is signed, still waiting, or finished. That overview makes a huge difference."
 Alina Heiner Founder of Maven
Report & Analytics
Get a demoMake decisions based on data, not assumptions.
Always know what’s going on inside your contracts. fynk extracts key data straight from your contracts to highlight what matters most. Find trends, patterns and hidden risks before they turn into problems.
Customized Dashboards
Get a demoSwitch between account, team, or personal dashboards.
See your contracts the way you need to. Create personal dashboards for your own work, team dashboards for shared responsibility, or account dashboards for full oversight. Same data, different views, without the distractions."Everyone looks at different parts of a contract, but we all look at the same dashboard and immediately see what's okay and what's not."
Lucas F. Jamnig Lead Counsel of fiskaly
Contracts, structured instantly.
Upload hundreds of contracts and extract clauses, dates, and values automatically for reporting.
"What I really like are the dashboards, the customizable dashboards that we adapt to our needs so everyone gets the key data really fast."

Where contract data comes together.
A single overview that replaces status updates, manual checks, and constant follow-ups across teams.
Saved views.
Save your filters once and reuse them anytime. Open the same dashboard whenever you need it. Ideal for regular reviews.
Access rights.
Dashboard visibility follows user roles automatically. Teams only see what is relevant to them. No extra setup required.
Faster decisions.
You spend less time checking details by checking all key info in one tab visible at a glance. Decisions happen faster.
Reuse data.
Dashboards use existing metadata and tags. There is no duplication or manual tracking. Everything is always updated.
Build your own view.
Your dashboard should fit your workflow. Add, move, or remove widgets as needed. Adjust the layout anytime.
Document calendar.
Important dates are shown in one place. Tasks and deadlines appear together. Nothing gets missed.


More product features to explore.
Draft.
Create contracts from proven templates — fast, consistent, and ready to send.
Boost.
AI reviews, summarizes, and explains your contracts so you never miss what matters.
Sign.
Send contracts for legally binding e-signatures — tracked from sent to signed.
Insights.
See the full picture of your contracts with dashboards, search, and smart alerts.
Frequently asked questions.
Dashboards in fynk provide a visual overview of contracts, tasks, and workflows. They help users understand what is happening across their contracts without opening each document or running manual searches.
Dashboards can be used by all users, but what they see depends on their role and permissions. Some users see only their own work, while admins and executives can see team or account level data.
fynk supports three dashboard types: personal dashboards, team dashboards, and account dashboards. Each type is designed for a different level of visibility and responsibility.
A personal dashboard only includes documents and tasks the user is directly involved in. This helps users focus on their own workload, deadlines, and responsibilities.
A team dashboard shows documents and activity assigned to one or more teams. It helps team members and managers understand shared workload and contract progress.
An account dashboard provides workspace wide visibility. It is mainly used by admins and executives to track overall contract volume, performance, and status across the entire organization.
Dashboards can display contract stages, contract values, upcoming work, calendars, and documents grouped by team, template, or stage. This makes it easy to spot trends and priorities.
Widgets are visual blocks inside a dashboard, such as calendars or workload views. Each widget focuses on a specific type of information and can be added or removed as needed.
Yes. Users can fully customize dashboards by adding widgets, moving them around, resizing them, or removing them. This allows dashboards to match different workflows and roles.
Yes. Users can create and save multiple dashboards for different purposes, such as daily work, reviews, or reporting, and switch between them easily.
Filters allow users to narrow down dashboard data by document stage, team, tags, contract types, or creation date. This helps focus on specific contracts or time periods.
Dashboard data is powered by existing fynk data such as metadata, tags, contract types, tasks, templates, and document activity. Dashboards reflect what is already happening in the system.
Still have questions?
See what your contracts are telling you. At a glance.
Turn scattered contract data into a single overview in fynk. Everything visible.